How to read and write data from a Python script using Forsta Plus public REST APIs, Jupyter Notebook and Quantipy.
With the Forsta Plus REST APIs for reading and writing survey data and custom data, some new possibilities have opened up for more easily performing off-site data processing and analytics using Python. There is a wide range of Python libraries available for different types of data manipulation.
Quantipy is a library for survey data, that can read and process dat from Dimensions, SPSS, Decipher, Ascribe and Forsta Plus. It has an open metadata format to describe and manage datsets, and supports cleaning, editing, recoding and transformation of datasets, computation and assessment of data weights, data aggregation, analysis and reporting.
There are various other Python libraries available for operations like cleaning (wrangling, munging), editing, recoding, transformation, merging, sorting, aggregation, statistics, visualization, machine learning & AI, and NLP.
For now, Python scripts and programs will need to be hosted off-site, running for example ad-hoc on a desktop using Jupyter Notebook.
This short guide explains how to get started with Python on desktop, with tools we recommend using. Follow the steps below to install Jupyter Notebook, access the REST API, and learn how to use the REST APIs to both read survey data and write data back to Forsta Plus.
Installation
Anaconda
The easiest way to get started with Jupyter Notebook is to install Anaconda, a toolkit to work with various open source packages and libraries.
Install Miniconda
-
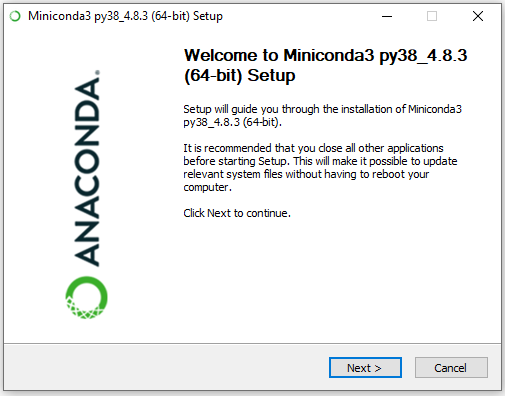
Download and install Anaconda Miniconda
-
If on Windows, install the Miniconda3 Windows 64-bit (including python 3.8) using default settings
-
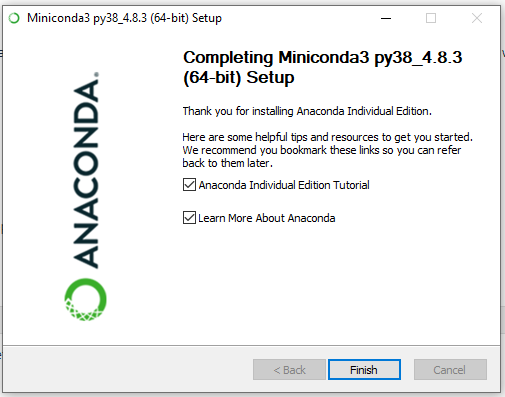
At the end of the process, click Finish to complete the installation
Python
Python 3.8 is already installed as part of the Miniconda installation in the "base" environment. However, it is recommended you create separate environments so you have control of which versions of 3rd party libraries are installed. Note that to run the quantipy3 example below, specific versions of libraries are required that might be different from those other scripts on the same machine require. Separate environments allow you to have different versions of the same library on the same machine.
Create environment and install python libraries
-
Open Anaconda Prompt (Miniconda3) (this is located in the start menu).

-
Create a new environment named "quantipy3" with a specific version of Python. We will use Python 3.7 for this example.
conda create -n quantipy3 python=3.7
-
Verify that the environment was created.
conda env list
-
Active the environment you have just created.
conda activate quantipy3
-
Install Jupyter Notebook.
pip3 install jupyter
-
Install the required Libraries.
pip3 install requests
pip3 install quantipy3
pip3 install scipy
Visual Code (optional)
As an alternative to running the Jupyter Notebook from the browser, you have the option of running the same notebooks from Visual Code.
Install and configure VS Code
-
Download and install VS Code - VS Code
-
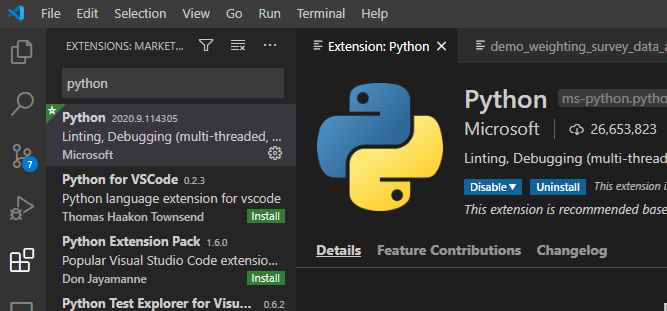
Install the Python Extension. VS Code will also recommend this extension if you open the file.

-
When opening the notebook file .ipynb, VS Code will start a Jupyter Notebook server automatically. The script can be executed in the same way as from the web.
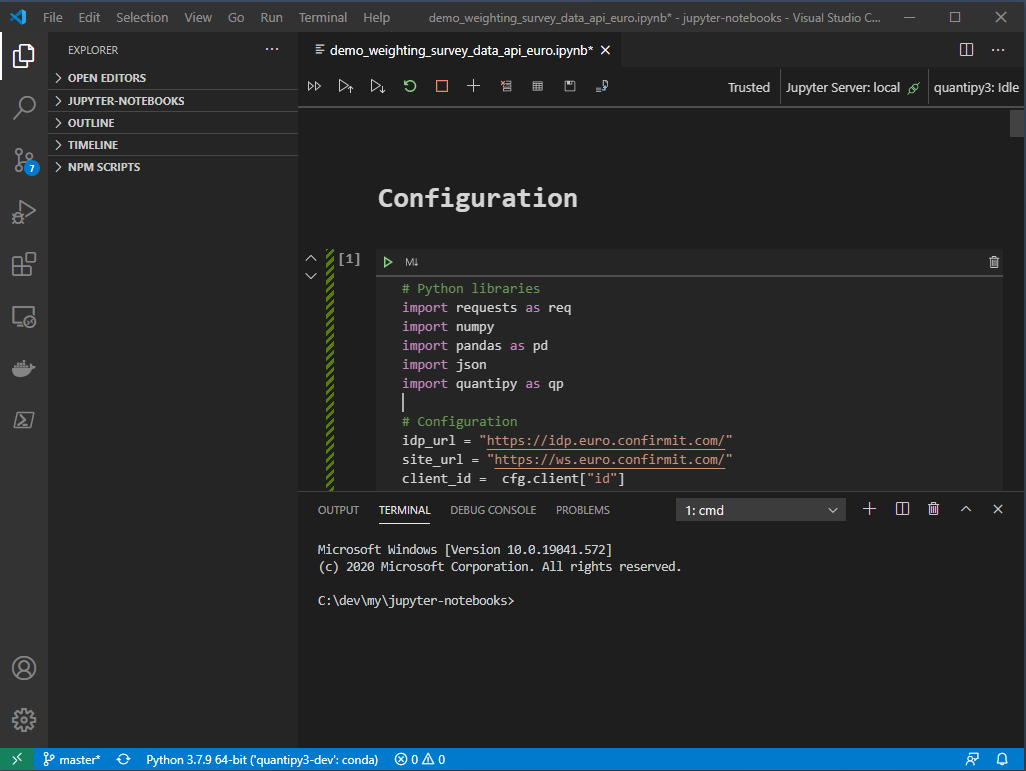
| The first time you run this you must make a couple of selections: |
-
When you open the notebook, click "Trust" or "Trust all notebooks".

-
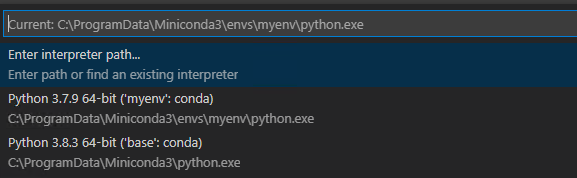
Select Python Interpreter and select the one you just created.
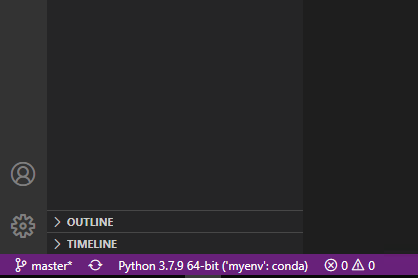
| You can change this by clicking the "Python… " text in the lower-left corner… |
Jupyter Notebook
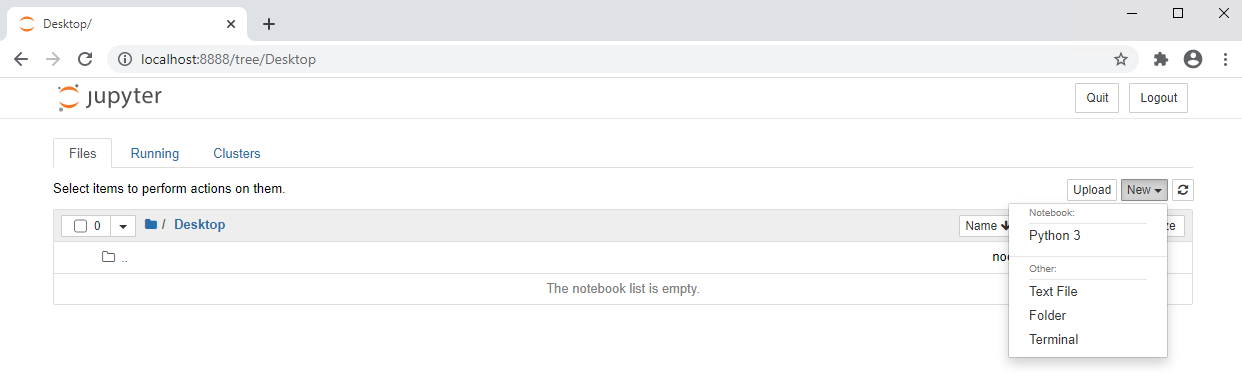
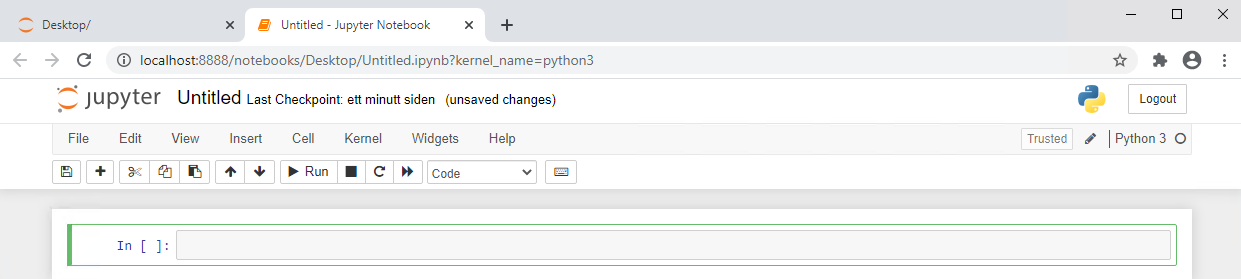
Start Jupyter Notebook
The installation instructions above are only required the first time you run the notebook. To start Jupyter Notebook later do the following:
-
Open Anaconda Prompt (Miniconda3) (this is located in the start menu).
-
Activate the environment and start Jupyter Notebook.
conda activate quantipy3
jupyter notebook
Access to Public APIs
Contact forstasupport@forsta.com to obtain a valid client ID and Client Secret so you can access the public REST APIs. You will need a valid Forsta Plus professional user with SYSTEM_API_ACCESS.
ClientI D: aa55d014-829c-454b-aaf9-dc4549d9fa80
Client Secret: 788e2edd-6084-4094-9b9d-1e0dc1979129
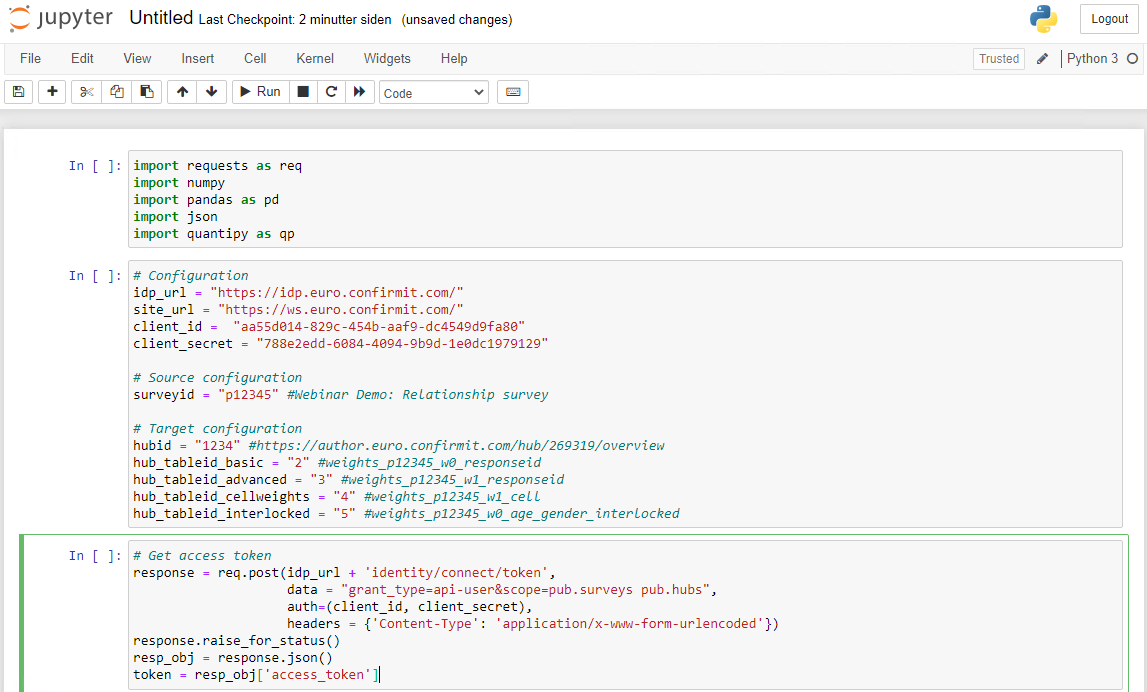
Python script, weighting example
import requests as req
import json
import numpy
import pandas as pd
import quantipy as qp# Configuration
idp_url = "https://idp.[euro|us|aus|nordic].confirmit.com/"
site_url = "https://ws.[euro|us|aus|nordic].confirmit.com/"
client_id = "aa55d014-829c-454b-aaf9-dc4549d9fa80"
client_secret = "788e2edd-6084-4094-9b9d-1e0dc1979129"
# Source configuration
surveyid = "p12345" #Webinar Demo: Relationship survey
# Target configuration
hubid = "1234" #https://author.[euro|us|aus|nordic].confirmit.com/hub/1234/overview
hub_tableid_basic = "2" # basic_weights
hub_tableid_advanced = "3" # advanced_weights
hub_tableid_cellweights = "4" # cell_weights
hub_tableid_interlocked = "5" # interlocked_weightsAlternative 1: Retrieve data using the API
First you must call the identity service endpoint to get a valid token using the Client ID/Secret. See "Security" for more information.
# Get access token
response = req.post(idp_url + 'identity/connect/token',
                    data = "grant_type=api-user&scope=pub.surveys pub.hubs",
                    auth=(client_id, client_secret),
                    headers = {'Content-Type': 'application/x-www-form-urlencoded'})
response.raise_for_status()
resp_obj = response.json()
token = resp_obj['access_token']# Get source data records
headers = {'Authorization': 'Bearer ' + source_token, "Accept": "application/x-ndjson", "Content-Type": "application/json"}
url = site_url + 'v1/surveys/' + surveyid + '/responses/data'
response = req.get(url, data = None, headers = headers, stream=False)
response.raise_for_status()
# Decode json response
res = response.content.decode("utf-8")
json_lines = res.splitlines()
json_data = []
for line in json_lines:
json_data.append(json.loads(line))
# Normalize the data in a pandas dataframe
df = pd.io.json.json_normalize(json_data)# Read data from pandas dataframe into quantipy dataset
dataset = qp.DataSet(name='test', dimensions_comp=True)
# Column 'name' is not allowed by quantipy
dataset.from_components(df.drop(columns=['name']))
# All columns are of type string. convert appropriate columns to singles to allow weighting
dataset.convert('fiscal_year', 'single')
dataset.convert('gender', 'single')
dataset.convert('age_group', 'single')
dataset.convert('region', 'single')
dataset.convert('continent', 'single')Alternative 2: Retrieve data using Quantipy
dataset = qp.DataSet("test")
dataset.read_confirmit_api(surveyid, site_url, idp_url, client_id, client_secret)# weighting basic rim weights
basicScheme = qp.Rim('test_basic')
# Targets
gender_targets = {}
gender_targets['gender'] = {1: 30, 2: 70}
age_group_targets = {}
age_group_targets['age_group'] = {1: 10, 2: 15, 3:10, 4: 35, 5: 30}
region_targets = {}
region_targets = {'region': {1: 10, 2: 15, 3:15, 4: 25, 5: 15, 6: 10,7: 10}}
all_targets = [gender_targets, age_group_targets, region_targets]
basicScheme.set_targets(targets=all_targets, group_name='basic weights')
basicScheme.groups['basic weights']['targets']
# Calculate weights
responseweights_basic = dataset.weight(basicScheme, weight_name='weight', unique_key='responseid', inplace=False)
responseweights_basic = responseweights_basic.reindex(['responseid', 'weight'],axis='columns')# Weighting with different weights within groups, and weighting on groups themselves
advancedScheme = qp.Rim('test_advanced')
# Targets within groups
gender_target_fy1 = {'gender': {1:40, 2:60}}
gender_target_fy2and3 = {'gender': {1:55, 2:45}}
AgeGroup_target_fy1 = {'age_group': {1: 10, 2: 15, 3:10, 4: 35, 5: 30}}
AgeGroup_target_fy2and3 = {'age_group': {1: 20, 2: 10, 3:15, 4: 20, 5: 35}}
region_target_fy1 = {'region': {1: 5, 2: 10, 3:5, 4: 25, 5: 30, 6: 10, 7: 15}}
region_target_fy2and3 = {'region': {1: 10, 2: 15, 3:15, 4: 25, 5: 15, 6: 10,7: 10}}
all_targets_fy1 = [gender_target_fy1, AgeGroup_target_fy1, region_target_fy1]
all_targets_fy2and3 = [gender_target_fy2and3, AgeGroup_target_fy2and3, region_target_fy2and3]
# Add fiscal year groups
filter_fy1 = 'fiscal_year == 1'
filter_fy2and3 = 'fiscal_year == 2 or fiscal_year == 3'
advancedScheme.add_group(name='fiscal year 1', filter_def=filter_fy1, targets=all_targets_fy1)
advancedScheme.add_group(name='fiscal years 2 and 3', filter_def=filter_fy2and3, targets=all_targets_fy2and3)
# Add targets for the fiscal year groups
fy_targets = {'fiscal year 1': 40, 'fiscal years 2 and 3': 60}
advancedScheme.group_targets(fy_targets)
# Calculate weights
responseweights_adv = dataset.weight(advancedScheme, weight_name='weight', unique_key='responseid',inplace=False)
responseweights_adv = responseweights_adv.reindex(['responseid', 'weight'],axis='columns')# create set with only cellweights for advanced scheme (fiscal year groups)
wdf = dataset.weight(advancedScheme, weight_name='weight', unique_key='responseid',inplace=False)
wdf = wdf.drop(columns=['responseid'])
wdfdistinct = wdf.drop_duplicates(subset=['fiscal_year', 'gender', 'age_group', 'region', 'weight'], inplace=False).reindex(['fiscal_year', 'gender', 'age_group', 'region', 'weight'],axis='columns').sort_values(by=['fiscal_year', 'gender', 'age_group', 'region'])# Create interlocked variable in dataset ('age_group' interlocked with 'gender')
interlocked_dataset = dataset.clone()
interlocked_dataset.interlock("age_gender", "age and gender", ['age_group','gender'], '/')
interlocked_dataset.convert('age_gender', 'single')
# set interlocked cell targets (cells correspond to [age_group 1, gender 1], [age_group 1, gender 2], [age_group 2, gender 1], ...)
interlockedScheme = qp.Rim('test_interlocked')
age_gender_target = {'age_gender': {1: 15, 2: 15, 3:10, 4: 5, 5: 10, 6: 15, 7: 10, 8: 5, 9: 10, 10: 5 }}
interlockedScheme.set_targets(targets=age_gender_target, group_name='interlocked weights')
# Calculate weights
interlocked_dataset.weight(interlockedScheme, weight_name='weight', unique_key='responseid',inplace=True)
interlockedweights = interlocked_dataset.subset(['age_group', 'gender', 'weight'], inplace=False).data().drop_duplicates(subset=['age_group', 'gender'], inplace=False).reindex(['age_group', 'gender', 'weight'],axis='columns').sort_values(by=['age_group'])# Insert records for response weights in custom table in hub
headers = {'Authorization': 'Bearer ' + token, "Accept": "application/json", "Content-Type": "application/json"}
# Basic weights
url = site_url + 'v1/hubs/' + hubid +'/customdata/tables/'+ hub_tableid_basic +'/records'
weights_basic = Obj()
weights_basic.dataSchema = Obj()
weights_basic.dataSchema.fieldNames = ["responseid", "weight"]
weights_basic.data = responseweights_basic.to_dict(orient='records')
weights_basic_json = json.dumps(weights_basic, default=lambda o: o.__dict__)
response = req.put(url, data = weights_basic_json, headers = headers)
print(response.status_code)
# Advanced weights
url = site_url + 'v1/hubs/' + hubid +'/customdata/tables/'+ hub_tableid_advanced +'/records'
weights_advanced = Obj()
weights_advanced.dataSchema = Obj()
weights_advanced.dataSchema.fieldNames = ["responseid", "weight"]
weights_advanced.data = responseweights_adv.to_dict(orient='records')
weights_advanced_json = json.dumps(weights_advanced, default=lambda o: o.__dict__)
response = req.put(url, data = weights_advanced_json, headers = headers)
print(response.status_code)
# cell weights
url = site_url + 'v1/hubs/' + hubid +'/customdata/tables/'+ hub_tableid_cellweights +'/records'
weights_cell = Obj()
weights_cell.dataSchema = Obj()
weights_cell.dataSchema.fieldNames = ["fiscal_year", "gender", "age_group", "region", "weight"]
weights_cell.data = wdfdistinct.to_dict(orient='records')
weights_cell_json = json.dumps(weights_cell, default=lambda o: o.__dict__)
response = req.put(url, data = weights_cell_json, headers = headers)
print(response.status_code)
# interlocked weights
url = site_url + 'v1/hubs/' + hubid +'/customdata/tables/'+ hub_tableid_interlocked +'/records'
weights_interlocked = Obj()
weights_interlocked.dataSchema = Obj()
weights_interlocked.dataSchema.fieldNames = ["age_group", "gender", "weight"]
weights_interlocked.data = interlockedweights.to_dict(orient='records')
weights_interlocked_json = json.dumps(weights_interlocked, default=lambda o: o.__dict__)
response = req.put(url, data = weights_interlocked_json, headers = headers)
print(response.status_code)class Obj(): pass
#Rename column to map survey data variable
weights = responseweights_adv.rename(columns={"weight": "adv_weight"}).head(10)
#Create json for survey weights
payload = Obj()
payload.dataSchema = Obj()
payload.dataSchema.keys = ["responseid"]
payload.dataSchema.variables = ["adv_weight"]
payload.data = weights.to_dict(orient='records')
payload_json = json.dumps(payload, default=lambda o: o.__dict__)# Get access token
response = req.post(idp_url + 'identity/connect/token',
data = "grant_type=api-user&scope=pub.surveys pub.hubs",
auth=(client_id, client_secret),
headers = {'Content-Type': 'application/x-www-form-urlencoded'})
token = response.json()['access_token']
print(response.status_code)headers = {'Authorization': 'Bearer ' + token, "Accept": "application/json", "Content-Type": "application/json"}
# Advanced weights
response = req.put(site_url + 'v1/surveys/' + projectid + '/responses/data', data = payload_json, headers = headers)
print(response.status_code)
print(response.content)Full notebook example
Click Notebook example to upload the full example. Remember to replace the examples in the configuration section with actual values.
Survey, SmartHub custom data and Studio setup
Import and launch survey
-
Log on to https://author.euro|us|aus|nordic.confirmit.com/surveydesigner
-
Import the example survey definition Example_survey.xml.
-
Launch the survey.
-
Import the example data Example_survey_data.xlsx.
Create a SmartHub with a source and custom data
-
Log on to https://author.euro|us|aus|nordic.confirmit.com/hub
-
Create a SmartHub and add the newly created survey
-
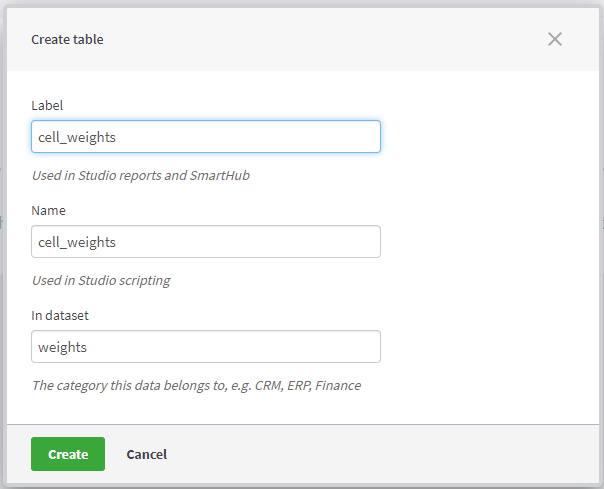
In the new SmartHub, create a data set named "weights" with the following tables:
-
NOTE: Once the tables have been populated from the Python script, the schema will be locked.
-
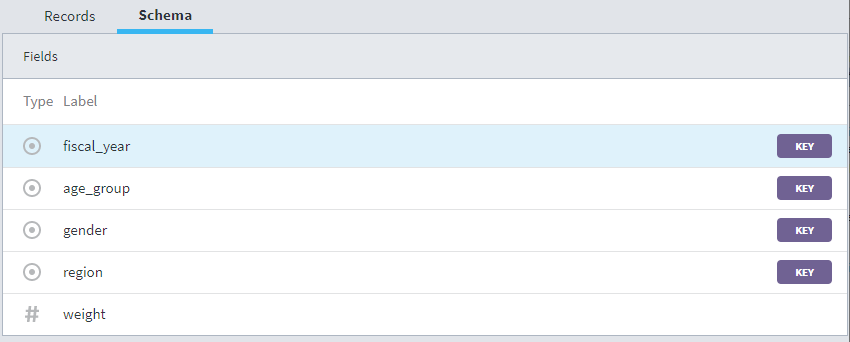
cell_weights
-
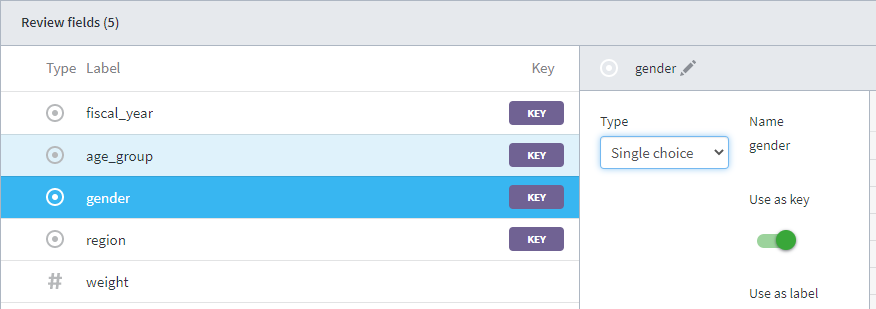
Upload Cell weights to create the columns in your table with the following data types and keys (click the fields to change the type and set the key).
-
-
-
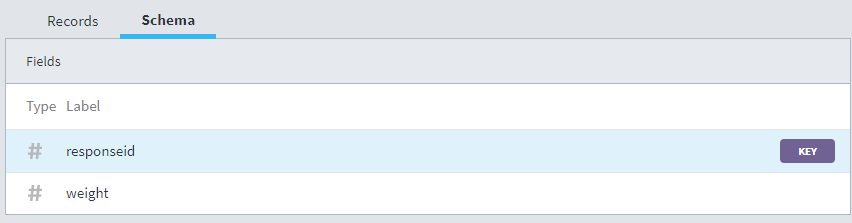
basic_weights and advanced_weights
-
Use Weights to upload data.
-
-
interlocked_weights
-
Use Interlocked Weights to upload data.
-
Create a Studio report
-
Open Studio and create a new report - https://studio.euro|us|aus|nordic.confirmit.com/apps
-
Copy and paste the content from the example report Studio Report and replace the hubid and surveyid with actual values.
config hub {
  hub: 1234 // replace with actual hub id

  table survey = p12345.response // replace with actual survey id
  table wbasic = weights.basic_wights
  table wadvanced = weights.advanced_weights
Links
Forsta Plus Public API docs
Miniconda docs - https://docs.conda.io
Anaconda getting started guide - https://docs.anaconda.com
Quantipy docs - https://quantipy3.readthedocs.io
Quantipy on github - https://github.com/Quantipy/quantipy3
Replace <site> in links above with the Forsta Plus site you are using, e.g. euro.confirmit.com or us.confirmit.com.